


India’s Urban Unemployment Rate Declines, Labor Force Participation Increases in Q1 2024
| For Prelims : National Sample Survey (NSSO), Unemployment, Periodic Labour Force Survey (PLFS) For Mains : Insights from the India Unemployment Report 2024 |
Why in News
Recently National Sample Survey (NSSO), have released data about the unemployment rate in urban areas for people aged 15 and above slightly dropped to 6.7% in the January-March period from 6.8% the previous year. The Periodic Labour Force Survey (PLFS) showed that unemployment rates for both men and women fluctuated throughout the quarters.
The National Sample Survey Office (NSSO) launched the Periodic Labour Force Survey (PLFS) in April 2017 to provide more frequent data on the labor force.
The key objectives of the PLFS are :
- To estimate employment and unemployment indicators like Worker Population Ratio, Labour Force Participation Rate, and Unemployment Rate on a quarterly basis for urban areas using the Current Weekly Status (CWS) approach.
- To estimate employment and unemployment indicators annually for both rural and urban areas using both the Usual Status (ps+ss) and CWS approaches.
The PLFS has already released 21 quarterly bulletins covering the period from the quarter ending December 2018 to the quarter ending December 2023. These bulletins present estimates of labour force indicators like Labour Force Participation Rate, Worker Population Ratio, Unemployment Rate, and the distribution of workers by employment status and industry of work in the CWS for urban areas.
This bulletin is the 22nd in the series, covering the quarter from January to March 2024.
Here is a rephrased version of the text:
Fieldwork for the Periodic Labour Force Survey (PLFS) during the January to March 2024 quarter:
The fieldwork for data collection was completed on time for both the first visit and revisit samples, except for a few cases:
- 10 first visit FSU (First Stage Units) could not be completed – 3 each from the states of Manipur and Madhya Pradesh, and 1 each from Punjab, Gujarat, Maharashtra, and Andhra Pradesh.
- 38 revisit FSUs could not be completed – 28 from Manipur, 2 each from Maharashtra, Telangana, and Tamil Nadu, and 1 each from Meghalaya, Chhattisgarh, Madhya Pradesh, and Andhra Pradesh.
These uncompleted FSUs have been treated as casualties in the survey.
Sample Design of PLFS:
The Periodic Labour Force Survey (PLFS) uses a rotational panel sampling design in urban areas. Each selected household is visited four times – first with an initial ‘First Visit Schedule’ and then three more times with ‘Revisit Schedules’ at periodic intervals. This rotation scheme ensures that 75% of the first-stage sampling units (FSUs) are matched between two consecutive visits.
Sample Size:
For the January-March 2024 quarter, the PLFS surveyed a total of 5,706 urban FSUs (urban sampling units from the Urban Frame Survey) nationwide. The total number of urban households surveyed was 44,598 and the number of persons surveyed was 169,459.
Key Employment and Unemployment Indicators:
The PLFS provides estimates for the following key employment and unemployment indicators under the ‘Current Weekly Status’ (CWS) approach:
- Labour Force Participation Rate (LFPR): The percentage of persons in the labour force (working or seeking/available for work) in the population.
- Worker Population Ratio (WPR): The percentage of employed persons in the population.
- Unemployment Rate (UR): The percentage of unemployed persons among the labour force.
The detailed results for the January-March 2024 quarter are available on the Ministry’s website.
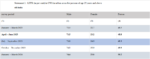
Labour Force Participation Rate (LFPR)
Key findings from the PLFS Quarterly Bulletin for January to March 2024 reveal a growing trend in the Labour Force Participation Rate (LFPR) among individuals aged 15 and above.
In urban areas, the LFPR has risen from 48.5% in January to March 2023 to 50.2% in January to March 2024 for individuals aged 15 and above. This increase is reflected in both genders, with the LFPR for males rising from 73.5% to 74.4% and for females rising from 22.7% to 25.6% during the same period.

The Worker Population Ratio (WPR)
The Worker Population Ratio (WPR) for individuals aged 15 and older has risen in urban areas, increasing from 45.2% in January – March 2023 to 46.9% in January – March 2024. The WPR for males increased from 69.1% to 69.8% during this time period, while the WPR for females increased from 20.6% to 23.4%.
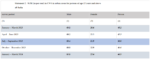

The unemployment rate (UR)
The unemployment rate (UR) for individuals aged 15 and above has seen a slight decrease in urban areas, dropping from 6.8% in January – March 2023 to 6.7% in January – March 2024. Specifically for males, the UR increased from 6.0% to 6.1% during the same period, while for females, the UR decreased from 9.2% to 8.5%.

Sources: PIB
National Sample Survey Office (NSSO)The National Sample Survey (NSS) or National Sample Survey Office (NSSO) is a large-scale household survey program conducted by the Ministry of Statistics and Programme Implementation (MoSPI) of the Government of India. Some key points about NSSO:
|
Sociology Optional Program for
UPSC CSE 2025 & 2026
 |
 |
 |
 |


 |
 |

Follow us :
🔎 https://www.instagram.com/triumphias
One comment